Gold at $3… or $40,000? The Chart That Changes How You See Gold
Is gold “expensive” at over $4,000… or are we still in the early innings of a much bigger move?
In the latest GoldSilver Show, Mike Maloney and Alan Hibbard walk through five bold predictions for gold, silver, and the dollar – starting with a chart Mike calls “100% irrefutable.” If you own metals, or are thinking about adding more, this one’s worth your full attention.
The Gold Chart LBMA Doesn’t Want You Looking At
Mike and Alan start with a simple question:
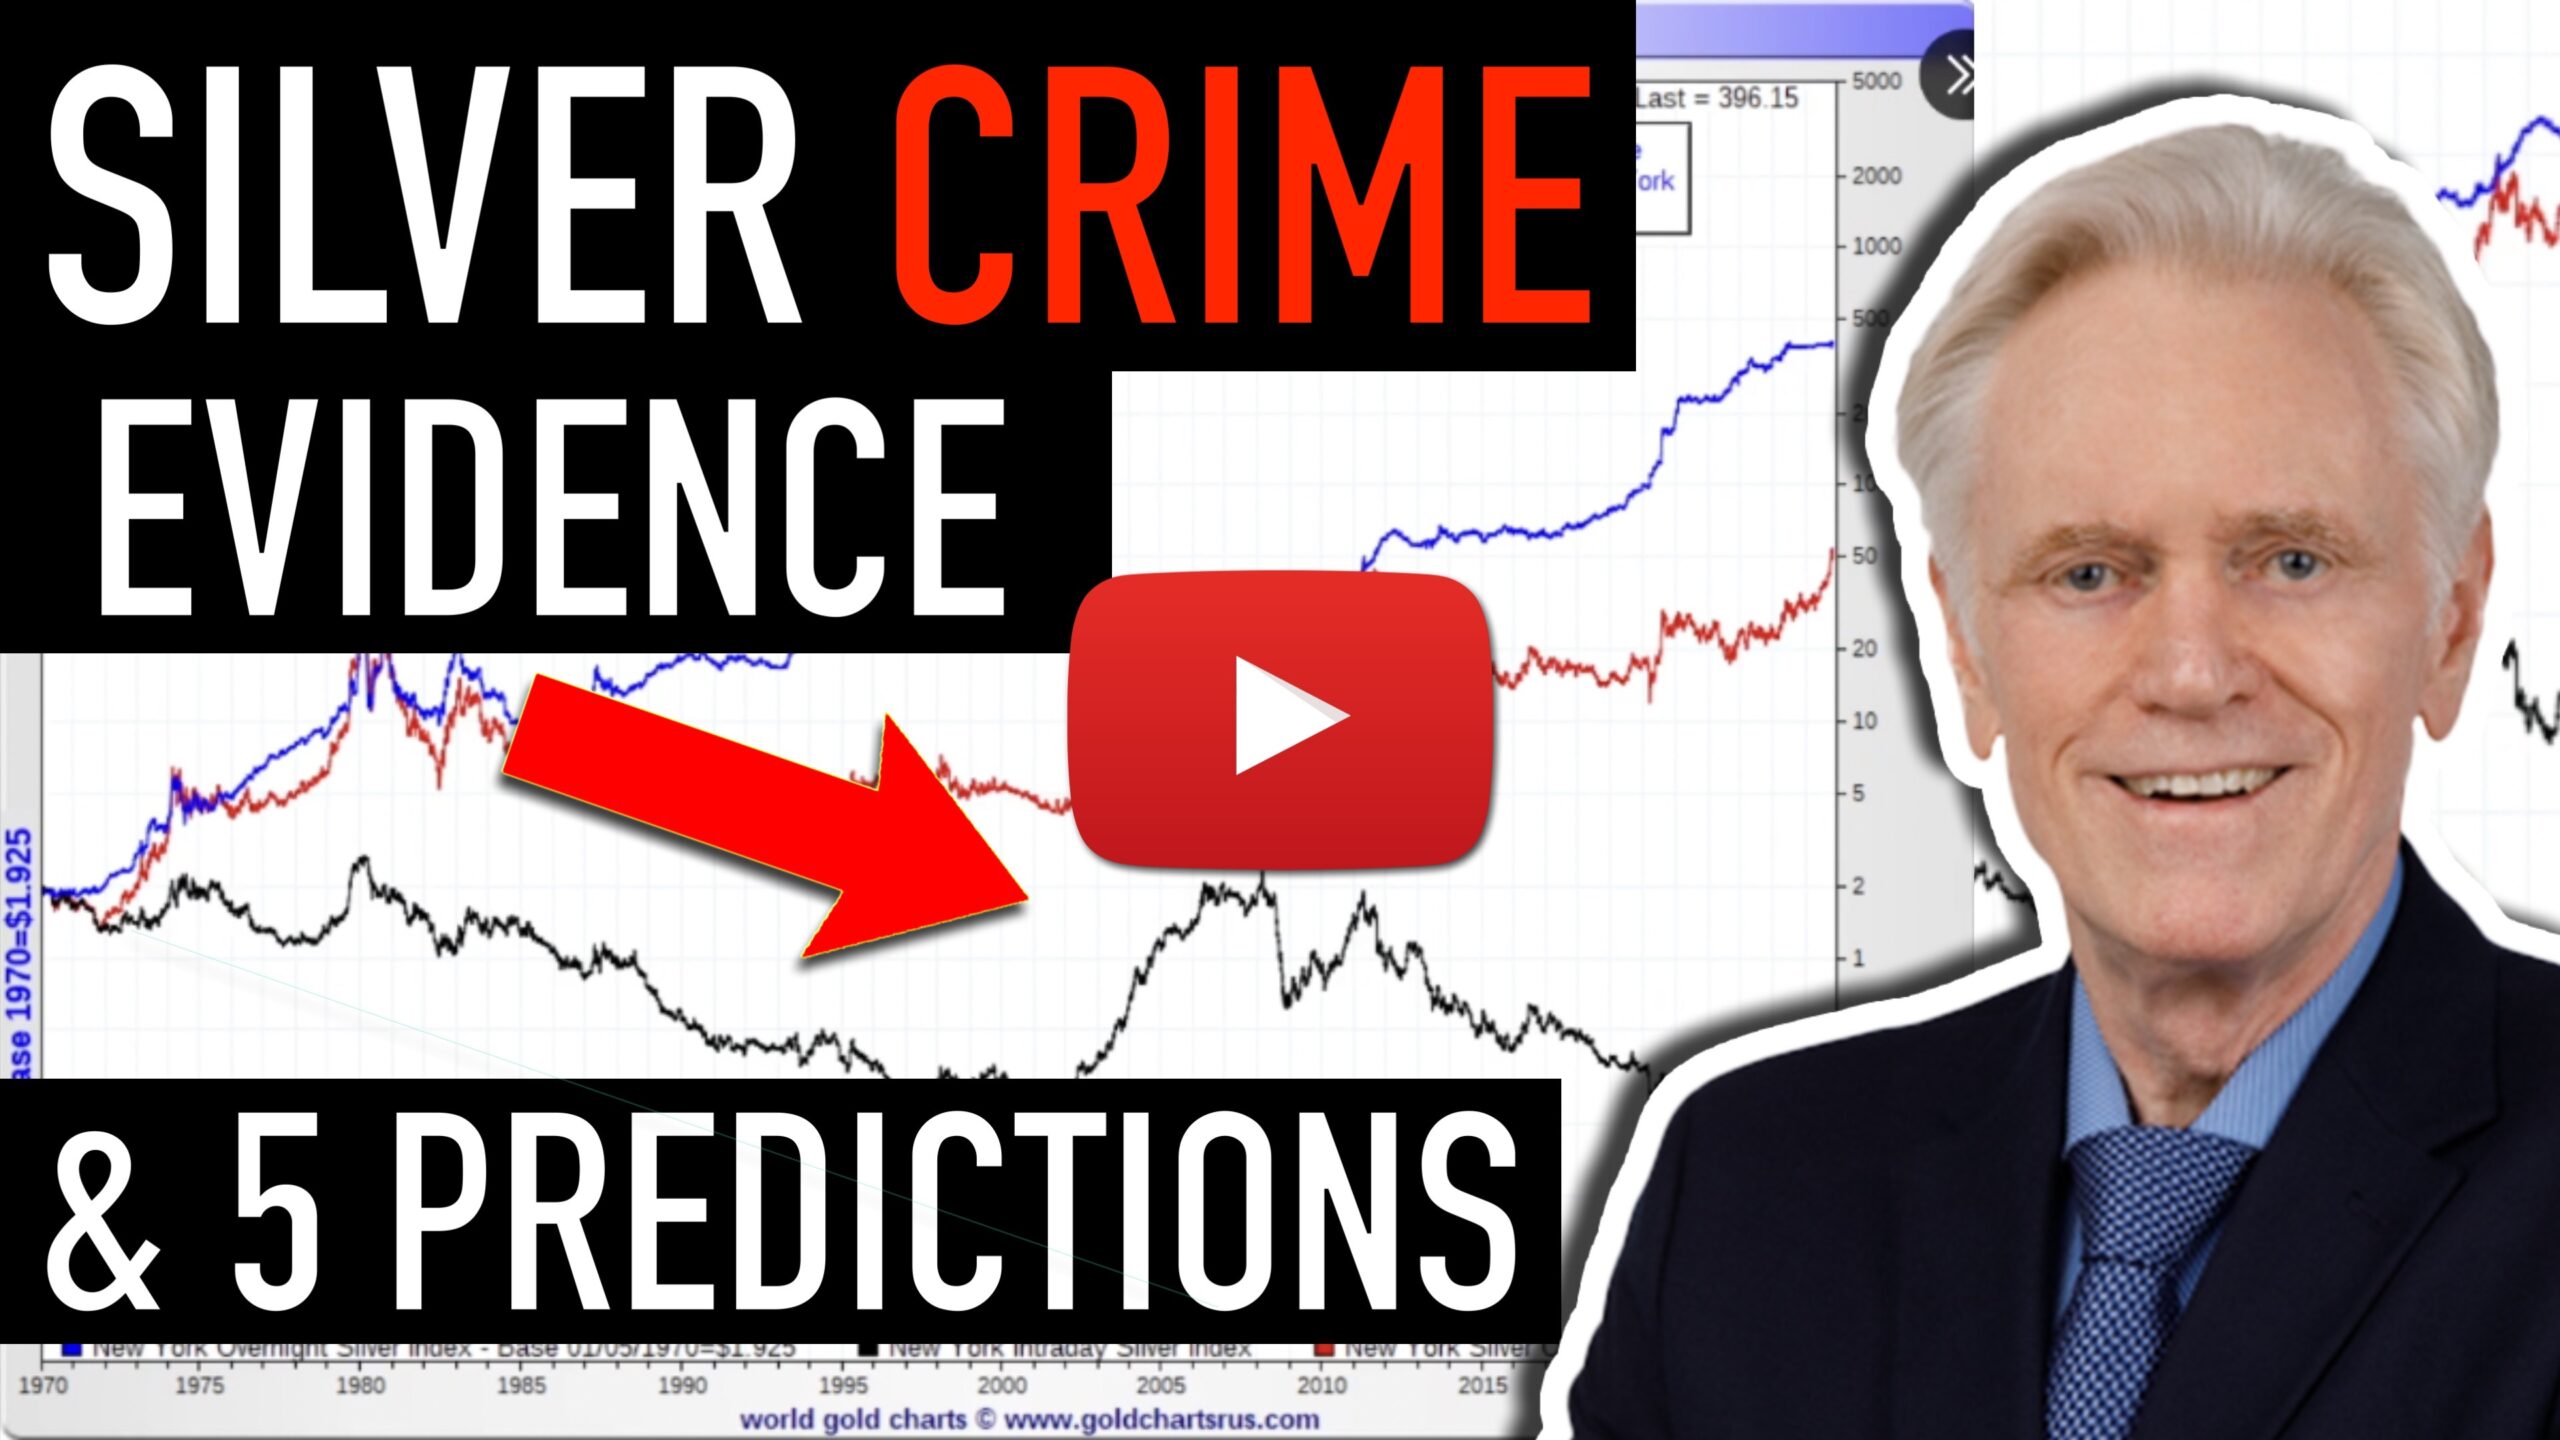
What happens if you separate gold’s price action into London trading hours vs. everywhere else?
When you stack the data that way, you get something shocking:
- If gold only traded during London hours, it would be around $3 an ounce today.
- If it only traded when London was closed, it would be just under $40,000 an ounce.
Same metal. Same historical prices. Different slices of the day.
That divergence is why Mike says the LBMA and COMEX look less like “markets” and more like long-running price suppression schemes that slowly grind gold (and silver) down in tiny daily increments.
And it’s not just gold. Silver shows a similar pattern—pushed down in London, bid up outside of it.
Triple-Digit Silver and the Structural Deficit
From there, Mike connects the dots to silver’s structural deficit. His point is brutally simple:
“When it doesn’t pay to mine the stuff, you don’t get enough coming to market to fill demand.”
Years of low prices, under-investment, and a massive paper market have created a setup where physical silver is consistently under-supplied. Mike argues this is a big reason triple-digit silver isn’t a wild forecast—it’s a logical outcome of broken price discovery.
If the paper games ever crack, the adjustment in physical pricing could be violent.
Is the U.S. Quietly Hoarding Gold?
One of the predictions Mike and Alan examine is that the U.S. government has been quietly accumulating gold since late 2024.
Officially, U.S. gold holdings haven’t changed in years. But when Alan pulls up charts of U.S. gold imports vs. exports, something stands out:
- The U.S. is usually a net exporter of gold.
- Recently, we’ve seen massive net imports – unusual inflows that look more like “someone big is getting ready for something really big.”
Not all of that gold is government-owned, of course. But if COMEX stocks only explain part of it, the rest has to be going somewhere.
And as Mike reminds viewers, central banks (including the Fed) have a long history of leasing gold, pledging it, and then playing balance-sheet games with the numbers. If the U.S. is refilling coffers quietly while the price is still (relatively) low… that says something about how they see the future.
Dollar Devaluation, Gold Revaluation, and the Debt Trap
Another prediction: a new “soft” dollar devaluation, similar to the Plaza Accord of 1985.
Back then, the dollar had doubled in five years, and major economies agreed to push it down. Gold, meanwhile, had been crushed.
Today, the setup is very different:
- The dollar has been roughly flat over the last five years.
- Gold has tripled, not fallen.
Alan’s takeaway: a coordinated, bilateral dollar devaluation like the old days is unlikely. Every country wants a weaker currency now. It’s a race to the bottom.
If the U.S. wants a weaker dollar, Mike says, it will likely be unilateral – more printing, more inflation, more currency “typed into existence.”
That leads to prediction #4: revaluing U.S. gold reserves.
The idea (floated in a Fed paper) is to raise gold’s official price from $42.22/oz to something closer to market levels, “unlocking” maybe a trillion dollars on paper.
Mike and Alan run the math:
- A move from $42 to ~$3,300 barely fills one year’s deficit.
- To actually wipe out the national debt, gold would have to be revalued somewhere in the $140,000–$150,000/oz range.
At that point, the numbers become system-breaking. You’re not just shuffling balance sheets—you’re detonating them.
Their conclusion: a small revaluation doesn’t solve the problem, and a big one is politically and economically explosive. That leaves the same path governments always choose: inflation.
What This All Means If You Own Gold and Silver
When you step back from the five predictions, a few key themes stand out:
- The bull market isn’t done. At $4,500, Mike still sees this as the beginning, not the end.
- Paper markets are fragile. LBMA and COMEX look more like control mechanisms than neutral venues for price discovery.
- Silver is structurally under-supplied. “It doesn’t pay to mine” is not a sustainable equilibrium.
- The debt trap is real. Revaluation gimmicks don’t fix it. Inflation is the default escape valve.
If your savings, retirement, or portfolio are tied to fiat currency and government bonds, those are not academic questions. They determine who eats the losses when the system adjusts.
Mike and Alan don’t claim to know the exact timing. But they’re crystal clear on the direction: currency devaluation, more volatility, and a bigger role for real money—gold and silver.
Investing in Physical Metals Made Easy
People Also Ask
Is gold expensive at over $4,000 an ounce, or is the bull market just starting?
Mike Maloney argues that $4,000 gold is not the end of the bull market, but the beginning. In the video, he explains why structural issues in the monetary system and precious metals markets suggest much higher prices are still ahead. Watch the full breakdown in “5 Astounding Silver & Gold Predictions” on the GoldSilver YouTube channel.
What is the LBMA gold price suppression theory Mike Maloney talks about?
By isolating gold’s performance during London trading hours versus when London is closed, Mike and Alan show a pattern where gold trends down in London but sharply higher outside those hours. They say this points to long-running, systematic price suppression on the LBMA and COMEX. See the charts and explanation in the full episode on GoldSilver’s channel.
Why does Mike Maloney believe silver could reach triple-digit prices?
Mike ties potential triple-digit silver to a long-running structural deficit: at today’s prices, it often “doesn’t pay to mine,” which starves the market of new supply while demand continues. He also highlights how paper silver trading can distort prices relative to physical fundamentals.
Has the U.S. government been secretly accumulating gold?
Official U.S. gold holdings appear flat, but Mike and Alan point to unusual spikes in net gold imports as evidence that “someone big” may be stockpiling metal. While they can’t prove secret government buying, they show why the recent flow data is highly unusual.
Can revaluing U.S. gold reserves solve the national debt problem?
According to Mike and Alan, revaluing gold from the statutory $42.22/oz to current market levels might raise roughly a trillion dollars on paper—barely covering a single year’s deficit. To actually wipe out the national debt, gold would need to be revalued into the six figures per ounce, which they say would be systemically destabilizing. For the detailed math and implications, watch “5 Astounding Silver & Gold Predictions” on the GoldSilver YouTube channel.


Post Comment